Air Quality
ESIG solvents’ volatile organic compounds (VOC) emission inventories
Our solvents’ Volatile Organic Compounds (VOC) emission inventories technical paper was updated earlier this year with following main changes:
- Inclusion of the most recent emissions data from the European Environmental Agency (EEA)
- Addition of ethanol emissions for all years dating back to 2013
- Corrections to the import and export estimation.
The updates were presented in May to the Task Force on Emission Inventories and Projections (TFEIP) in April Oxford (TFEIP 2023 meeting in Oxford).
The data indicates as before that solvents’ VOC emissions have remained stable within the range of 2000-2300 ktonnes in the EU28 (EU27+UK) since 2008.
Currently the review process of the 2021 data is in full swing. ESIG has provided all data available (2013, 2015 and 2017 till 2021) for each EU member state and the UK to the reviewing team. This has been done using the mapping table from the EMEP/EEA guidebook allowing us to compare our data which is reported in REACH end-use sectors to the Nomenclature for Reporting (NFR) which parties to the convention have to use.
The focus of the 2023 review is on agriculture. It has been announced that the 2024 review (of the 2022 data) will centre on solvents.
Results of EMEP Intensive Measurement Period
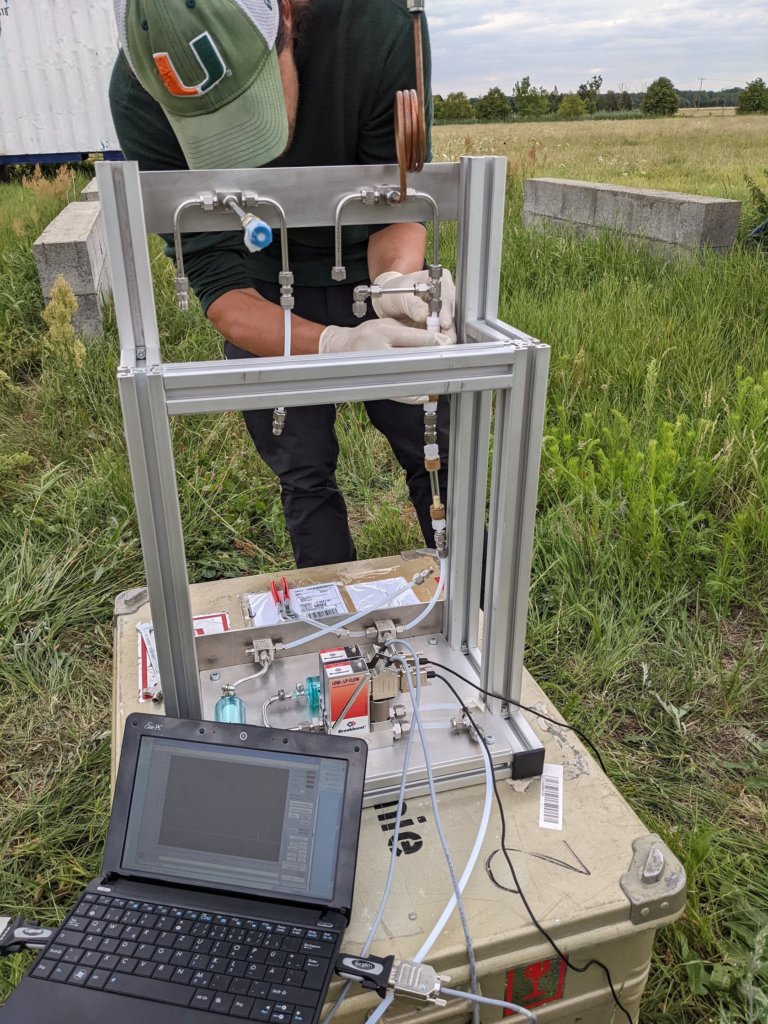
In our previous edition of “Solutions,” we shared news about a week-long intensive measurement campaign that took place during a summer heat wave from 12th to 19th July 2022. It focused on measuring a range of VOCs (NMHCs, O-VOC, terpenes), as well as biogenic organic aerosol tracers.
The aim was to investigate the relevance and importance of different ozone precursors during heat waves. To gather this valuable information, manual devices for sampling VOCs were distributed, and samples were then analysed at centralised laboratories. ESIG provided financial support for this campaign.
In total, 4755 datasets could be collected from 27 sites in 13 countries. 146 components were traced and added to EBAS, a database hosting observation data of atmospheric chemical composition and physical properties (Choose project CAMPAIGN and year 2022). Where there are no known VOC species (116), organic compounds are specified by new mass class (116 VOCs species and 6 sums of species (mass classes)
During the TFMM meeting in Warsaw, Poland, in May, the four laboratories responsible for device distribution and analysis presented some preliminary results. A summary of the findings will be included in the EMEP status report for 2023. Furthermore, the plan is to publish the full results in a peer-reviewed journal later this year.
Additionally, the initial findings from the ACROSS campaign were shared at a dedicated thematic session during the General Assembly of the European Geosciences Union (EGU). While the results are not yet conclusive, we anticipate that further publications will follow in the coming months.
For EMEP Intensive Measurement Period:
For ACROSS:
Review of the Gothenburg Protocol
TRENDS IN OZONE
(copied from ECE/EB.AIR/2022/4 – Scientific information for the review of the Gothenburg Protocol )
Ground-level ozone (O3) is a secondary pollutant that results from complex physicochemical mechanisms. Therefore, observed average concentrations do not change at the same rate as reductions in regional precursor emissions (NOx and non-methane volatile organic compounds (NMVOCs)), and are influenced by other factors such as climatic parameters, hemispheric transport and global methane (CH4) emissions. In Europe, O3 peaks have declined systematically (by around 10 per cent between 2000 and 2019). The health-related SOMO35 (for O3, the sum of means over 35 parts per billion (daily max. 8-hour)) indicator decreased by about the same magnitude. The annual average O3 concentrations remained constant and tended to increase in urban areas.
Observed trends in O3 pollution are largely dependent on the metric considered, with large variability between trends in annual mean concentrations and trends for other metrics relevant to health (SOMO35) and ecosystem exposure, or most intense peaks. The trends are also notably different when considering a diversity of monitoring station typologies and geographical areas. Trends are affected by so-called titration effects, in which decreasing NOx emissions can increase O3, especially in wintertime. Over the period 2000–2018, annual mean O3 increased as much as 11 per cent, whereas a slight decrease (3 per cent) was observed in rural areas. Such a difference between station typology is driven by the titration effect: the sum of O3+NO2 declining by 2 per cent and 13 per cent for urban and rural sites, respectively.
Trends in summertime O3, and metrics of higher O3 (maximum daily average 8-hour concentration, the sum of mean over 35 parts per billion (SOMO35), are stronger and clearer than those in annual data, though site-to-site variability is large. Using stringent data capture criteria, median trends in daily maximum O3 during June–August were 0.6 parts per billion per year (ppb/yr) at EMEP sites (EMEP model -0.4 ppb/yr). Observed trends showed much more variability than modelled trends, with observed trends being more affected by the high O3 summers of 2003 and 2006 in some regions.
O3 peaks decline systematically (by 11 per cent and 6 per cent at rural and urban sites, respectively), but this range of decline can be considered limited regarding the -47 per cent and -54 per cent changes for NMVOC and NOx emissions, respectively, over the same time period. This discrepancy expressed in relative trends is largely influenced by O3 mitigation strategies only effectively reducing – in excess of a certain natural burden that remains difficult to estimate. Additionally, these trends for the period 2000–2018 are still largely influenced by the outstanding 2003 and 2006 O3 years, even for O3 peaks. O3 peaks tend not to show any significant declines for the years post-2007, except in Southern Europe.
REVIEW PROCESS
In line with the legal requirements from the Gothenburg Protocol (GP), the Executive Body of the Long-Range Transboundary Air Pollution (LRTAP) convention in its 39th session in December 2019, initiated the review of the amended protocol through different studies and investigations.
The review report was accepted three years later, in the 42nd session of the Executive Body in December 2022, and the advanced version of the meeting report has been published end of March 2023. https://unece.org/sites/default/files/2023-03/Advance%20version_ECE_EB.AIR_150.pdf
To address the conclusions of the review, an ad hoc group of experts has been formed to develop adequate policy options. As part of the review, it was found that methane emissions are the main driver of increasing background ozone levels, and thus, will need to be addressed. The expected increase in global methane emissions is projected to offset the reductions of NOx and NMVOC emissions – the precursors of ground-level ozone.
Furthermore, additional actions for all five pollutants including NMVOCs already covered in the GP are also requested.
ZOOM IN: SOLVENTS VOC EMISSIONS
The latest emission data shows that while NMVOC emissions have decreased by 43% in the EU (EU27+UK+EFTA), 23% in the USA, and 27% in Canada, there has been an 11% increase in the ECCA (Eastern Europe, the Caucasus and Central Asia) countries. Despite the reductions, it is expected that some parties will not meet the NMVOC emission targets without additional measures.
Regarding NMVOCs, some parties need to take additional actions in terms of road transport, solvent use, and domestic wood burning to address the issue. It was also noted that even with full implementation of the Protocol, background levels of ozone in the ECE region are expected to continue to increase due to methane, NOx and NMVOC emissions outside the ECE region.
The Gothenburg Protocol has several annexes, most of them of technical nature. All were subject to the review process as well. https://unece.org/sites/default/files/2022-03/TFTEI%20review%20of%20annexes%20to%20the%20Gothenburg%20Protocol.pdf
Annex VI examines the limit values for emissions of VOC from stationary sources – and it is proposed to adapt the emission limit values (ELVs) from the recently published “Best Available Techniques” (BAT) Reference Document on Surface Treatment Using Organic Solvents including Preservation of Wood and Wood Products with Chemicals (STS BREF)[1] and the associated decisions.
Annex XI deals with solvents in products and, next to shorter sections on the US and Canada, currently mirrors the EU “Paint Directive”. The review process revealed that very little information is available to enable the update of emission limit values (ELVs) and that even current limit values are already deemed quite challenging. No other product groups have been discussed in this context.